Happy Friday, traders…
Ben here.
In the current market environment, we want to be more conservative with the setups we enter … and trade positions as quickly as possible.
This is not the time to make multi-week swing trades, so I’ve been focusing on day trading. But like any trader, some of my setups work better than others…
This week, I had a solid win and a totally avoidable loss — both on the same day.
If you want long-term success in the options market, you can’t simply bask in your wins … you must also take extreme ownership of your losses.
There are a few reasons for this:
Getting too wrapped up in the glory of your gains can lead to overconfidence, overvaluing your skill, and discounting the role of luck.
By all means, take pride in your winning trades — but don’t let them go to your head.
Contrarily, evaluating your losses — however painful it may be — can actually help you improve your performance more than anything else in your trading journey.
By being honest about why your trade went south, you can identify your mistakes, and vow to never make those errors again.
So, let’s break down my two trades from Wednesday, and do our best to determine why one worked (and why the other didn’t)…
My +38% Win on Apple Calls
My first trade on Wednesday was on Apple Inc. (NASDAQ: AAPL)
When you’re preparing to make a day trade in the morning, you should use all of the tools at your disposal…
Use Your Technological Tools
Before anything, I look at my scanners. If I don’t see anything I’m super excited about, I move on.
(Some traders rely too much on scanners. Use them, but don’t depend on them. Don’t think you have to trade a position from the scanner.)
Again, you’ve gotta know what you’re looking for in the options market.
And if you don’t see trades that fit your specific criteria, there’s nothing wrong with trading something else (or not trading at all).
This happened to me on Wednesday. I wasn’t seeing anything I loved on my scanners, so I looked elsewhere…
Use Your Brain
Moving on from the scanner, I was looking at Apple because Apple is the market and the market is Apple.
In other words, Apple tends to react similarly to the major indexes. It’s a good proxy for the overall stock market.
So, when the CPI numbers came in cool, showing inflation at 2.9% (a three-year low), I thought Apple was primed to move higher.
Use the Chart
Next, I needed to confirm my thesis on the AAPL chart.
I did some simple technical analysis, marking the $220-$222 range that AAPL was trading within:

Then, I had a clear visual representation of support and resistance levels, which allowed me to determine whether my two favorite long call chart patterns were in play:
Breakouts
I was watching for a break of the $222 level. When trading breakouts, I use small sizes to manage risk.
Ideally, I want to see the chart break the level and hold (or break the level, come back to retest the level, and then move higher).
When these resistance levels break, the chart has a high probability of flying higher.
Plus, looking at the options chain, someone was loading up on AAPL calls, which gave me further confirmation that the ‘smart money’ was seeing what I was seeing.
I bought the AAPL 8/16/24 $222.50 calls at $2.00, and scaled out from there:
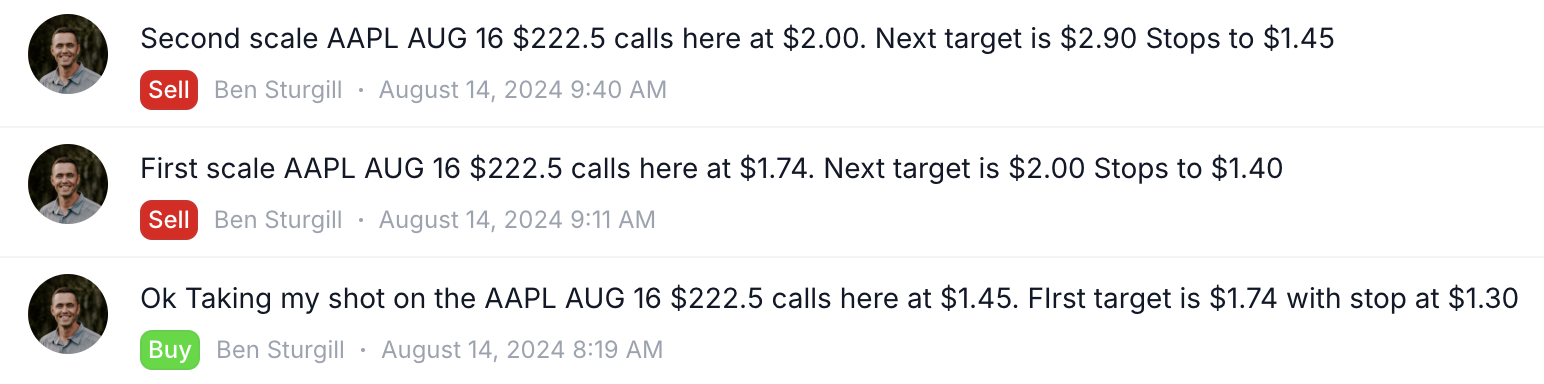
This was a 38% gain in 1 hour and 21 minutes.
But if you want to take less risk in a similar setup, consider buying the pullback…
Pullbacks
To execute a pullback buy, look at the demand zones (levels where huge buying pressure occurs)…
Place your buy orders near the demand zone levels, and you’ll take on less risk because your stop-loss won’t be far below that.
When trading options, it’s usually helpful to pay attention to where others are participating, which is where these demand zones, volume, and open interest come into play.
Lessons Learned from BMY
After AAPL, I started to look at Bristol-Myers Squibb Co (NYSE: BMY)…
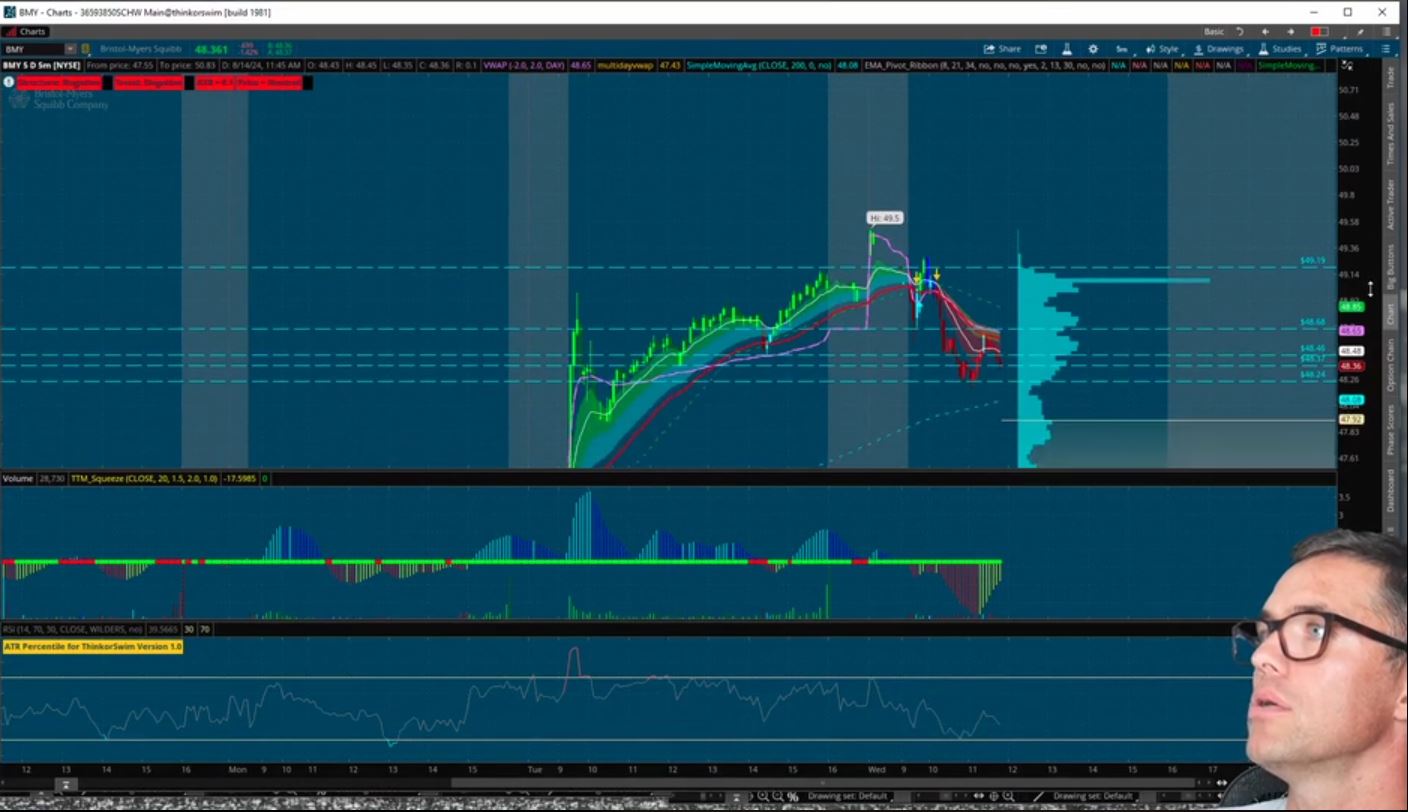
First, I looked at the options chain and noticed the 8/16/24 $49.50 and $50 calls getting huge volume.
Then, I moved to the chart — which looked like it was setting up a “3x a Lady” pattern.
Finally, I saw that the prior day’s chart ended on strength, implying that BMY could be headed higher…
I had the options chain, volume, and chart all in agreement. The setup was looking beautiful.
But the trade didn’t work, and here’s why…
First, I set my demand zone too high. I saw the chart bouncing off of the $48.25 level, and thought if it held that level, it would act as significant support.
But there was a lower demand zone, near the low-of-day at $47.60. And that zone was more in play than I thought it was.
My big mistake was underestimating a relatively wide range on the chart.
Second, I misread the chart and failed to see a bearish head-and-shoulders pattern forming on the top end of the range.
But it’s easy to see in hindsight…
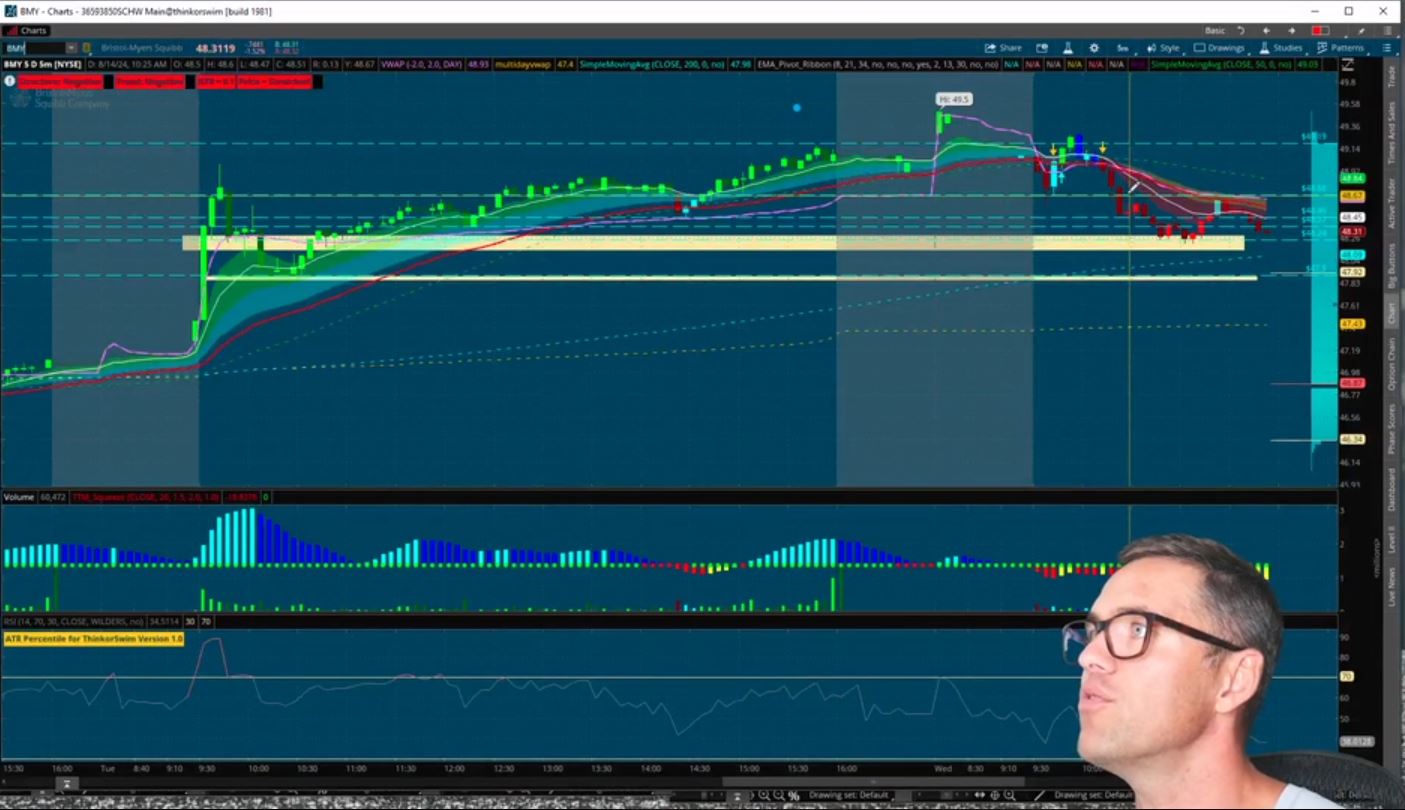
$49.15 to $49.50 was actually major resistance, and I made a mistake going long into these levels.
As mentioned earlier, I’m trying to take extreme ownership of my mistakes, so that I don’t make them in the future.
Start doing the same by going through your losing trades and I promise you’ll notice areas of your performance you can improve upon.
Now, before we go, let’s look at:
💰The Biggest Smart-Money Bets of the Day💰
(EXTRA LARGE BETS TODAY!)
- $22.6 million bullish bet on NVDA 08/30/2024 $130 calls @ $3.80 avg. (seen on 8/15)
- $12.5 million bearish bet on BP 12/20/2024 $40 puts @ $5.95 avg. (seen on 8/15)
- $6.7 million bullish bet on AAPL 09/27/2024 $230 calls @ $4.63 avg. (seen on 8/15)
Happy trading,
Ben Sturgill
P.S. My brand-new specialized system for trading earnings season — Operation: Master Calendar — is off to a rip-roaring start.
Take a look at the results from my first 4 trade ideas:
EQR 8/16/24 $70 calls @ ~ 2.30
20% move from ~$2.30 to $2.75*
FFIV 8/16/24 $185 calls @ ~3.60
456% move from ~$3.60 to $20*
HOLX 8/16/24 $85 calls @ ~0.75
69% move from ~$0.75 to $1.27*
WELL 8/16/24 $115 calls @ ~1.00
116% move from ~$1.00 to $2.16*
If you want access to this system — which can predict moves like these before they happen — Click here now to join Operation: Master Calendar!
*Past performance does not indicate future results