Happy Monday, traders…
Jeff here.
Last week was a crazy one…
The markets sold off sharply on Wednesday after the Fed’s hawkish tone rattled confidence, with the Dow plunging over 1,000 points and the S&P 500 seeing its worst one-day decline since 2020.
(Days like this are why I’ve warned you all year about this mania-driven market bubble.)
But by Friday morning, when the PCE numbers showed lower-than-expected inflation, the bulls came roaring back, staging a near-term recovery:

Volatility is back, prices are swinging all over the place, and the market looks drastically different than it did just a few days ago.
And as the market trend shifts, your mindset (and strategy) needs to change as well…
If you get married to a pattern or position — unwilling to change your setups when the market calls for it — you’re dooming yourself to failure.
I’m telling you this today because the market could be gearing up for a major trend reversal to the downside.
And if you aren’t ready for it, you’ll get smoked…
But if you’re appropriately positioned during a big reversal — you could make a small fortune.
Take it from me: I once made $1 million in a single day during one of the biggest market reversals in history.*
With that in mind, here are three simple steps to help you time (and trade) trend reversals…
Listen to What the Market is Telling You
When a big trend reversal takes place, there are always some traders who get caught flat-footed.
They don’t see the reversal train barreling towards them and fail to get off the tracks before it’s too late.
But there’s an easy way to avoid this: by listening to the price action.
The stock market has a personality. If you pay attention (and know what to look for), it’ll send you clear signals about where the price action might be headed.
Here are three things to watch out for when confirming (or denying) a major trend reversal:
1. Volume Confirms the Move
Volume is a key indicator of whether a price move has staying power.
A true trend reversal will be accompanied by extremely elevated trading volume, as Wall Street starts shifting its positions.
Last Friday’s rally was impressive, but here’s the issue: volume was low compared to the heavy selling we saw on Wednesday and Thursday.
That’s a red flag, suggesting the relief rally might have a limited lifespan and could fade quickly without stronger participation.
When you see a big move with lackluster volume, it often signals that large Smart Money players — who drive sustained trends — are sitting on the sidelines.
Instead, these types of rallies are usually powered by retail investors or short-term traders covering positions.
(This was even more true on Friday, as the triple-witching day saw millions of futures and options contracts expiring simultaneously.)
Don’t chase these rips. Use caution and wait for a more convincing signal before committing to long positions.
2. Watch for Breaks at Key Levels
A major trend reversal often coincides with the market bouncing off key support or breaking through major resistance.
These key price levels act as psychological barriers for traders and investors — as well as literal limit-order barriers for the price to exceed.
Last Wednesday’s sell-off broke through a few high-end support levels on the S&P 500, like the 50-day moving average (the yellow line below):

By Friday, the index had not only held above those levels but climbed back, reclaiming territory lost earlier in the week.
Plus, the really serious support tests — like the 200-day moving average (the lime green line above) — are still well below current levels.
While this bounce was encouraging, a true recovery needs to hold above the 50-day moving average.
Identify these key levels on your charts and watch how the market reacts. A strong bounce from support or a decisive breakthrough resistance with follow-through could signal a genuine trend shift — but only if volume confirms the move.
If the market struggles to break resistance or fails to hold support on a retest, it’s a clear sign that the trend has not yet reversed.
3. Sentiment Shifts Dramatically
Market sentiment is one of the most overlooked indicators of a trend reversal. When everyone is either euphoric or deeply bearish, the market tends to move the other way.
Last Wednesday, fear was palpable. The CBOE Volatility Index (VIX) spiked 40%, its biggest single-day surge in five years.
By Friday, sentiment had shifted dramatically, with traders quickly stepping back into beaten-down names.
But sentiment shifts alone aren’t enough — you need to look for confirmation through price action and volume.
Pay attention to sentiment extremes — whether it’s through the VIX, put-call ratios, or even the tone of financial news.
When fear or greed reaches unsustainable levels, a reversal is often near. However, it’s critical to watch how the market behaves after these extremes to avoid false signals.
Where Do Stocks Go From Here?
While Friday’s rally was a welcome breather for bulls, the lower volume is concerning. It’s too early to declare the start of a new trend. The market remains volatile, and the Fed’s hawkish stance still looms large.
Use these three indicators — volume, support and resistance, and sentiment — to guide your decisions in the days ahead.
When you combine these three signals, you’ll get a clearer picture of whether a near-term move is the sign of a true reversal.
Don’t chase relief rallies, manage your risk, and look for confirmation before committing to new positions.
Happy (cautious) trading,
Jeff Zananiri
P.S. In times of market uncertainty, why not let AI pick your trades for you?
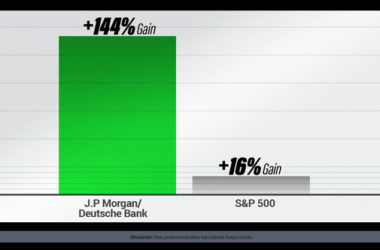
If you’re ready to capitalize on the gains my AI-powered GAMMA Code system has been delivering me every week — 145%, 235%, 630%, and even 900% — all in 24 hours or less* — then now is the time…
TODAY, December 23 at 10:00 a.m. EST, I’m hosting a SPECIAL LIVE WORKSHOP to show you how to weaponize GAMMA for huge overnight gains.
Time is running out — Don’t miss your chance to join.
*Past performance does not indicate future results