Happy Monday, traders…
Ben here.
Options trading is all about timing, but nailing this is easier said than done.
So, let me simplify it for you…
When a chart breaks a multi-day, multi-week, or even multi-month resistance level — that’s the ideal time to buy calls.
I’ve booked eye-popping profits by recognizing when key price levels start to crack (and entering trades accordingly).
My ability to spot these key price levels has helped me achieve an 82.6% total win rate (since building and utilizing my Spyder Scanner):
276 Trades
228 Wins
47 Losses
1 Breakeven
Win Rate = 82.6%*
Average Trade Result = 62.9%*
Average Gain of Winning Trades = 90%*
These days, students are always asking me how I know which levels to watch — and how they can spot those levels in their own analysis.
Today, we’ll answer these questions once and for all. Let me show you how to identify (and trade around) key price levels…
Know Your Chart History
I’ve said it before and I’ll say it again … In the stock market, you’ve gotta know your history.
But I’m not just talking about historical headlines, events, and macroeconomic data — I’m talking about the history of the chart you’re trading.
When I’m trying to determine key price levels, I first zoom out on a daily or weekly chart and see where the stock has continually failed (or bounced).
If the chart bounces at the same price over and over again, that’s a level of historical support.
If the chart fails at the same price over and over again, that’s a level of historical resistance.
I lean towards trading bullish positions via call options, making resistance a bit more important for me.
A huge part of my trading strategy is looking for resistance levels to crack. When these multi-day or multi-week levels get taken out, there’s a high probability that the chart will continue moving up.
Let me show you a recent example that led to a banger trade…
During my July 24 Daily Strike Alliance Webinar, I called out AT&T Inc. (NYSE: T) as a potential calls trade.
Specifically, I mentioned I was watching the $19 level as resistance. My thought was, if the stock cracked that level, I would likely buy calls…

You can see how tall the wicks were getting when the stock neared $19, which told me that traders were trying really hard to get this chart above that level, but facing resistance…
This is exactly what I’m looking for. I want to buy the calls immediately after the key level breaks, giving me the best opportunity to book juicy profits.
And sure enough, that’s what happened…
When T broke $19 that morning, I alerted the following entry:
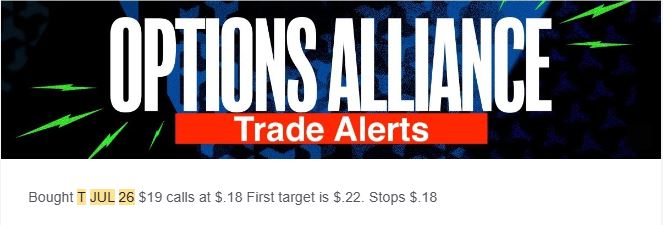
Unsurprisingly, the stock started running higher. Then, over the next 24 hours, I scaled out in batches:


By the time I closed my final scale on July 25, the calls had surged from $0.22 to $0.50 — a gain of 127% in just over 24 hours.
This is the undeniable power of identifying key price levels in action…
If you want to learn how to spot these levels to inform your options trading, there’s no better place to start than in the Daily Strike Alliance. Click here now to join our incredible community of active options traders.
Psychological Price Levels and Big Round Numbers
With experience, you’ll notice that certain “psychological price levels” pop up on chart after chart…
Oftentimes, these levels coincide with big round numbers like $20, $50, $100, $200, etc.
And if you think about this logically, it makes a lot of sense.
Traders are watching the same levels and setting limit orders around them, causing big bounces (or dumps) when the share price nears that level.
It’s not hard to believe that many traders around the world might want to sell a stock that’s been running once it hits a number like $100.
This is simple “profit-taking” as traders attempt to buy low and sell high. But once they all start selling, it creates a resistance level for the stock.
Then, the next time the share price gets close, traders will be on high alert, creating a double-whammy effect.
This works the same way on the low end of the chart.
Traders will set limit buy orders when they feel the stock is getting too cheap. And if enough traders do this near the same level, it can cause a massive bounce — forming a level of support.
All this to say, pay attention (and be cautious) when a chart you’re watching nears a big round number.
These are just a few ways you can identify key levels. Respect the price levels and look to enter your positions when those levels are broken.
Now, before we go, let’s check out:
💰The Biggest Smart-Money Bets of the Day💰
- $2.9 million bearish bet on FND 08/16/2024 $95 puts @ $4.60 avg. (seen on 7/26)
- $2.5 million bullish bet on XLF 01/25/2025 $42 calls @ $3.35 avg. (seen on 7/26)
- $2.1 million bearish bet on SQ 08/02/2024 $60 puts @ $2.96 avg. (seen on 7/26)
Happy trading,
Ben Sturgill
P.S. I recently designed a specialized calendar system to accurately exploit earnings season for potentially massive gains…
And in its first day of existence, this system has already identified two 50%+ winners:
MSFT 8/16/2024 $440 Calls (Moved from $5.80 to $8.80)
ABBV 8/16/2024 $185 Calls (Moved from $3.15 to $4.85)
Stop making bad earnings trades — Get access to Operation: Master Calendar by clicking right here!
*Past performance does not indicate future results