Happy Monday, traders…
Ben here.
Options trading is all about direction.
If the underlying stock doesn’t go in the direction of your contracts, your position is toast.
This is the delicate balance of risk and reward within options trading…
On the one hand, if you can correctly predict the near-term direction of a stock price — you can make a lot of money quickly (with minimal upfront risk).
On the other hand, if you’re wrong about direction — even for one day — your contracts could lose a big chunk of their value, thus ruining your trade.
Unlike stock trading, there’s a shot clock on every options trade called theta (a.k.a. time decay).
Options contracts begin losing value from the moment they’re written…
Like an ice cream cone on a hot summer day — you better eat it fast, or it’ll melt before your very eyes.
That said, this directional difficulty is precisely what makes options trading so profitable … when it’s executed with discipline and precision.
So, today, I’m gonna show you my two favorite chart patterns for directional trading…
My Top 2 Directional Chart Patterns
There are two specific chart patterns that I love to use for directional trading:
Pattern #1: The Breakout
A breakout occurs when a stock surpasses its support or resistance levels.
These levels represent the price points where the stock has struggled to move beyond during a specific period.
Breakouts are a strong indicator that the stock is likely to continue its trend, you could be in at the beginning of something BIG…
But there’s a catch…
Some breakouts eventually prove to be false breakouts — when a stock cracks a key level, lulling traders into a trap, only to quickly drop back below (or above) it.
And the key to identifying a breakout vs. a false breakout is daily trading volume.
If I see a stock crack a resistance level on low volume, I won’t be rushing to buy calls.
But if I see a break above a key level with huge daily trading volume — ideally bolstered by even more options volume — I’m far more likely to trade that setup.
For example, look at the February breakout in Wells Fargo & Co. (NYSE: WFC):
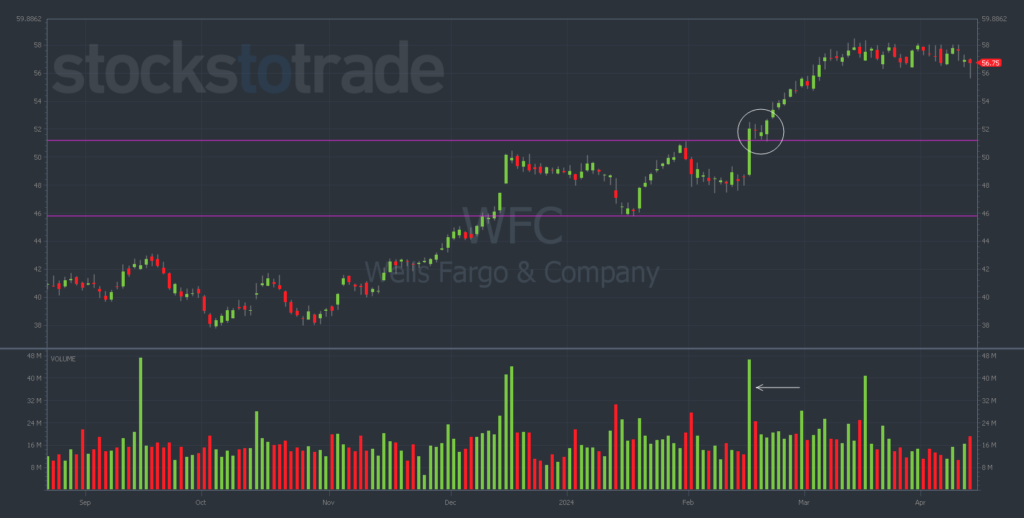
From December 2023 to mid-February, WFC was rangebound between $46 (support) and $51 (resistance).
But as soon as the $51 level broke on massive daily trading volume, the stock entered a classic breakout uptrend, surging 13% in three weeks.
While there are no guarantees in the options market, volume helps confirm direction.
Now, onto the next pattern…
Pattern #2: The Pullback
The Pullback Pattern is exactly what it sounds like…
The share price “pulls back” to a support level — often after a strong move higher.
This is due to profit-taking.
Traders hit their price target and sell — often at an important round-number price level — causing a pullback.
Then, after holding the support level, the price reverses back to the upside.
Contrary to breakouts, pullbacks usually work best on lower volume.
You want to see big volume during the bullish rally, followed by lower-volume selling and consolidation back to support.
CAUTION: If there’s enormous selling volume, that’s usually a sign there’s something seriously wrong (i.e. the COVID crash of March 2020). That’s not what we’re looking for with pullback trades.
The benefit to pullbacks is that you can get a great entry price, especially if you’re trading options.
A few minor red days after a big run-up can take a huge bite out of call option premium, giving you a beautiful entry point for your trade.
Let’s look at Taiwan Semiconductor Manufacturing Company Ltd. (NASDAQ: TSM) — a chart that’s provided a bunch of pullback opportunities recently…
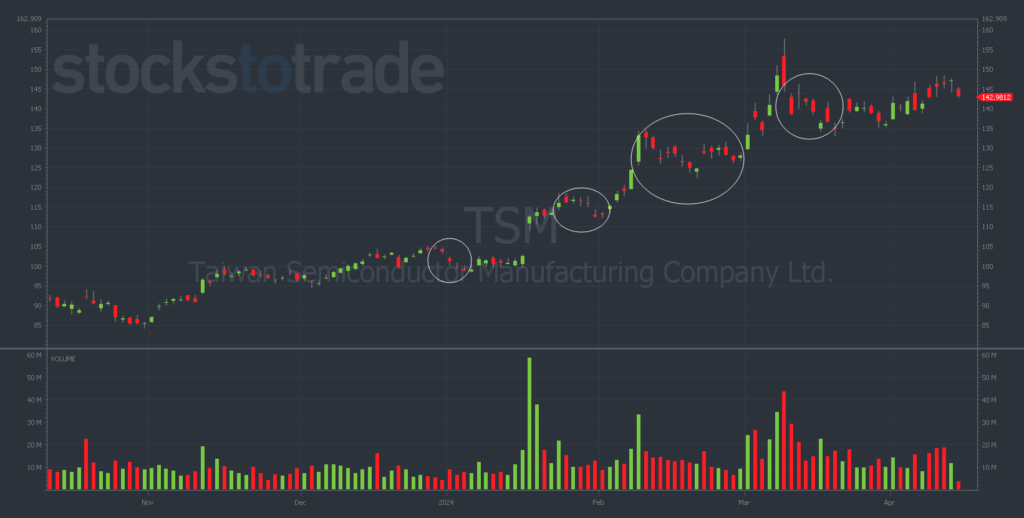
Notice that:
- The green volume is almost always greater than the red volume…
- When the chart pulls back, it does so to a support level (or a higher low), keeping the uptrend intact.
I want you to start looking for breakouts and pullbacks on your charts.
Identifying these directional chart patterns can lead you to some incredible trading opportunities.
And speaking of incredible trading opportunities, let’s look at:
💰The Biggest Smart-Money Bets of the Day💰
- $3.53 million bullish bet on GLD 05/17/2024 $230 calls @ $3.05 avg. (seen on 4/12)
- $3.43 million bullish bet on FCX 06/21/2024 $50 calls @ $3.45 avg. (seen on 4/12)
- $3.24 million bullish bet on AAPL 05/31/2024 $180 calls @ $4.00 avg. (seen on 4/12)
Happy trading,
Ben Sturgill
P.S. Are you struggling to find five-star trades in this choppy market?
Well, it’s time to stop struggling…
This FRIDAY, April 19 at 12 p.m. EST — my colleague Danny Phee is hosting an urgent LIVE WEBINAR where he’ll reveal the most promising ‘smart money’ trades we’re seeing this week.
Don’t miss out — CLICK HERE NOW TO RESERVE YOUR SEAT

