Happy Wednesday, traders…
Ben here.
In a recent SPYDER Live Workshop, I talked about technical analysis and its importance for options traders.
I mentioned several technical indicators I place on my charts, including:
- 200-day simple moving average (SMA) — The average price of the stock over 200 days, visualized as a “moving” line on the chart.
- 14-day relative strength index (RSI) — A momentum oscillator that measures the speed and change of price movements. RSI reads as a number between 0 and 100. (RSI is usually considered overbought when above 70 and oversold when below 30.)
- Average true range (ATR) — The average of true ranges over the specified period. This measures volatility while considering any gaps in the price movement.
- Volume profile — The volume traded at various price levels over a specified period.
But the truth is, there’s one technical indicator that trumps all of the others.
This indicator is a secret weapon, giving you a clear visual representation of a chart’s overall trend.
The vast majority of traders don’t even know this secret weapon exists.
But if you learn to employ it, you can potentially create an edge for yourself and exponentially improve your trading performance.
Today, I’ll show you how utilizing this one technical indicator can change your trading forever…
How The 21-day EMA Works
A huge part of trading is accurately identifying trendlines.
Stocks tend to get stuck in both uptrends and downtrends, depending on how traders feel about the name.
If you’re trying to long a stock (or trade call options) — you must know where the trendline is.
And the same goes if you’re trying to short a stock (or trade put options).
Some traders draw their own trendlines on charts, which can work for some…
But over the years, I’ve discovered that the 21-day exponential moving average (EMA) does most of that work for you.
Time and time again, I see the 21-day EMA acting as support for uptrends (and as resistance for downtrends).
By paying attention to the 21-day EMA, you can take most of the guesswork out of identifying your uptrends and downtrends.
Let’s look at some examples…
Identifying Uptrends
NOTE: For all of the following examples, the 21-day EMA will be represented by the yellow line.
I want to show you how the 21-day EMA can confirm a bullish uptrend:
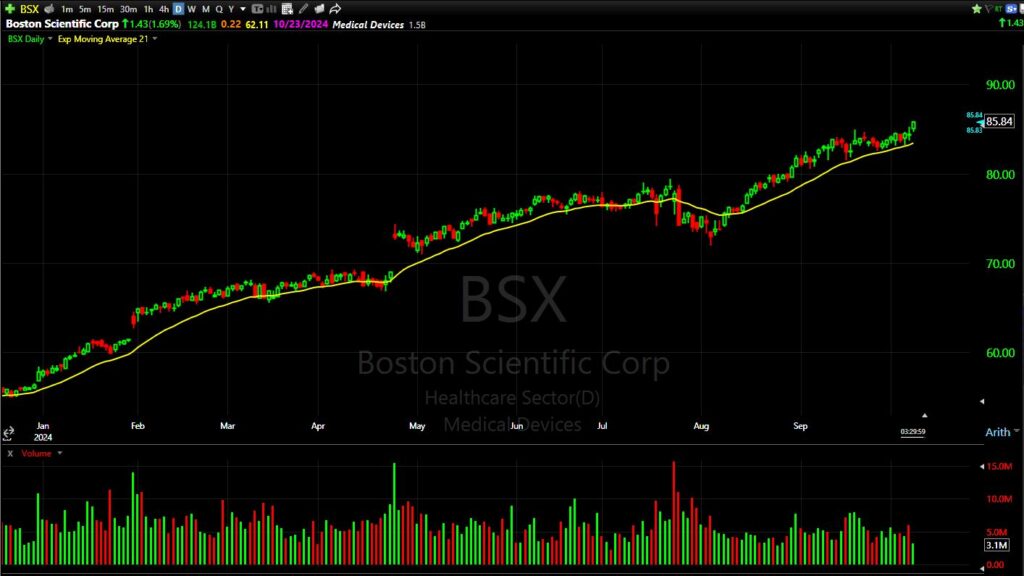
Since the beginning of 2024, the 21-day EMA line on the Boston Scientific Corporation (NYSE: BSX) chart has been a perfect indicator.
It confirms the uptrend and gives you a visual illustration of the chart’s direction.
Every time the chart reverted back to (or just below) the trendline, that was a screaming buy signal for a swing trade.
Same thing on this eBay Inc. (NASDAQ: EBAY) chart…
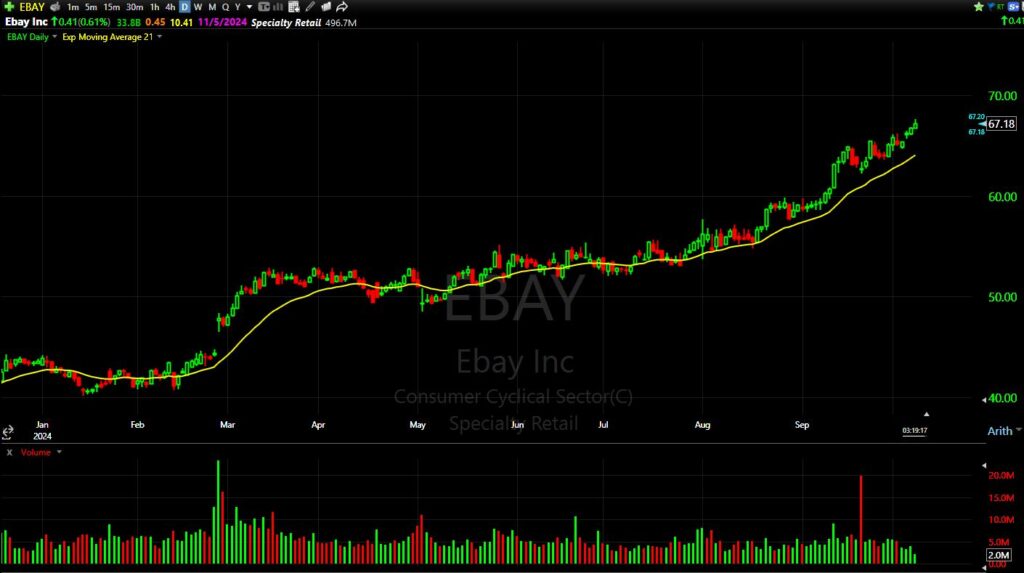
The price action lines up with the 21-day EMA like they’re married to each other.
So, let’s say you wanted to get in on EBAY calls anywhere in this trendline.
The only thing you would’ve needed to do was wait for the chart to re-test the 21-day EMA, then enter.
Contrarily, if you see a chart that’s overextended beyond the trendline — be patient and wait for the mean reversion before buying your calls.
However, the best part of this indicator is that it works on both sides of a trend…
Identifying Downtrends
“But Ben, I’m a huge bear and I want to buy puts. Does this indicator work for downtrends as well?”
It sure does…
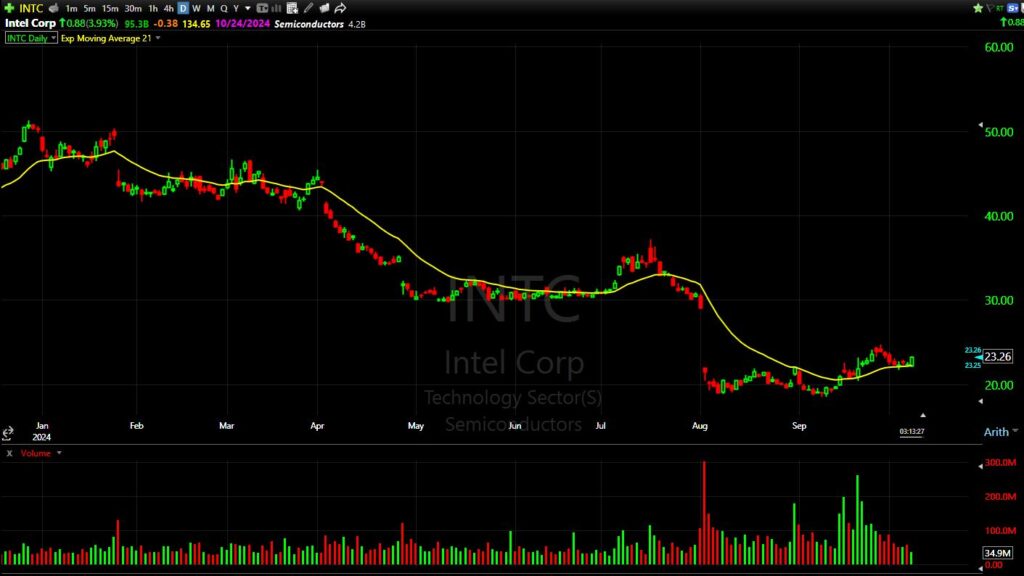
In an almost mirror-inverse chart to EBAY, Intel Corp. (NASDAQ: INTC) has been stuck under the 21-day EMA downtrend for over a year.
As you can see, every time INTC tries to crack the yellow line — it gets brutally rejected.
Again, you could’ve used this indicator to know when and where to buy puts. As soon as the chart neared the yellow line — that was a signal to buy puts.
Same with this LULU chart…
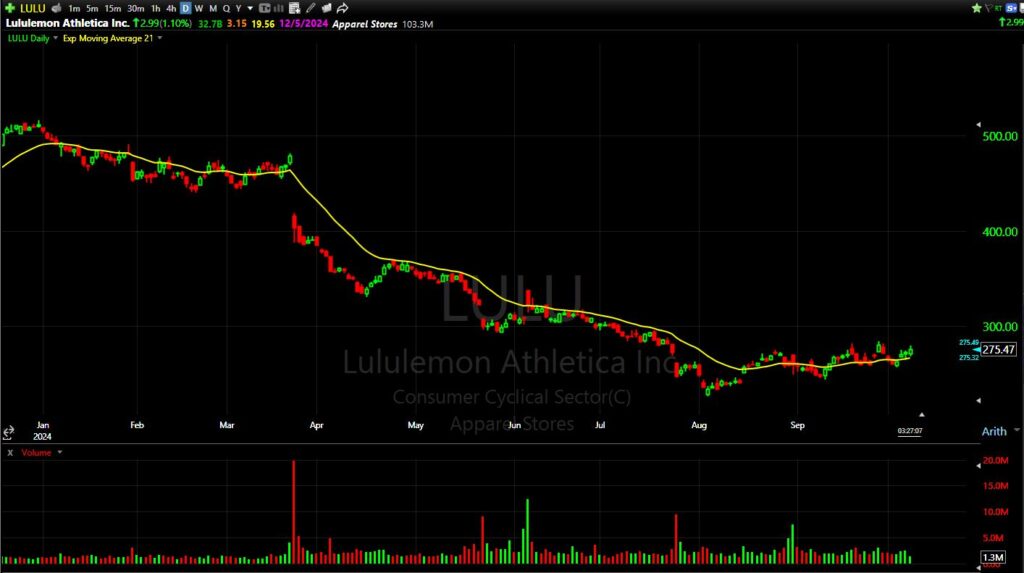
Look back at January…
Had you noticed the chart losing the 21-day EMA and bought puts at that moment, you could’ve made a fortune holding those contracts over the entire year.
And you could’ve done the same in mid-March…
The 21-day EMA is a magic line for identifying uptrends and downtrends.
Add this indicator to your charts and use it as a barometer for how close to (or far away) a chart is from its overall trend.
Bottom Line: This is a game-changer when implemented correctly.
Before we go, let’s look at…
💰The Biggest Smart-Money Bets of the Day💰
- $14.7 million bullish bet on NVDA 10/18/2024 $138 calls @ $1.65 avg (seen on 10/8)
- $1.3 million bearish bet on AMD 10/11/2024 $167.50 puts @ $2.45 (seen on 10/8)
- $950,000 bullish bet on CCJ 11/15/2024 $55 calls @ $1.90 (seen on 10/8)
Happy trading,
Ben Sturgill
P.S. Earnings season starts on Friday…
But despite what many traders think, earnings aren’t a mysterious enigma, completely unknown before the news breaks…
With the right tools and data, you can often see whether a company will beat or miss before the report occurs.
Click here to get a secret glimpse into earnings season with Operation: Master Calendar!