Happy Wednesday, traders…
Ben here.
When you trade a stock, you only really have two choices: long or short.
But when you trade options, you have many more … well, options.
This trips newbies up. When people try to trade options for the first time, they’re often overwhelmed by the sheer complexity of the market.
There are hundreds of thousands of options contracts to choose from every single day.
Strike prices, expiration dates, volume, open interest, delta, gamma … it’s a lot to digest.
And this is exactly why I focus on trading contracts with big ‘smart money’ volume.
I want an unfair advantage — an undeniable edge in this vast marketplace.
You see, what sets big institutional ‘smart money’ apart from retail traders in their Mom’s basement is information.
By following the ‘smart money,’ I give myself a huge leg up over my competition.
I can base trades on the ‘smart money’s’ data without actually having it.
I don’t need to know the material, non-public information that these mysterious traders might be using…
I simply need to know what to look for, pay close attention to my Spyder Scanner, and pull the trigger when the opportunity presents itself.
(Doing so recently led me to a 167% winner, more on that later…)*
But then, even if you narrow your potential ‘options’ down to ‘smart money’ bets from my Spyder Scanner, you’re still left with a lot of contracts to choose from.
Recently a student asked me, “Ben, how exactly do you choose the contracts you trade?”
With that in mind, I’m gonna show you five components I look for in a winning ‘smart money’ trade setup…
The Importance of Volume and Price
First and foremost comes volume and strike price.
I need to see some major volume on the contracts to get really interested. This shows me that the ‘smart money’ is trading these contracts heavily right now.
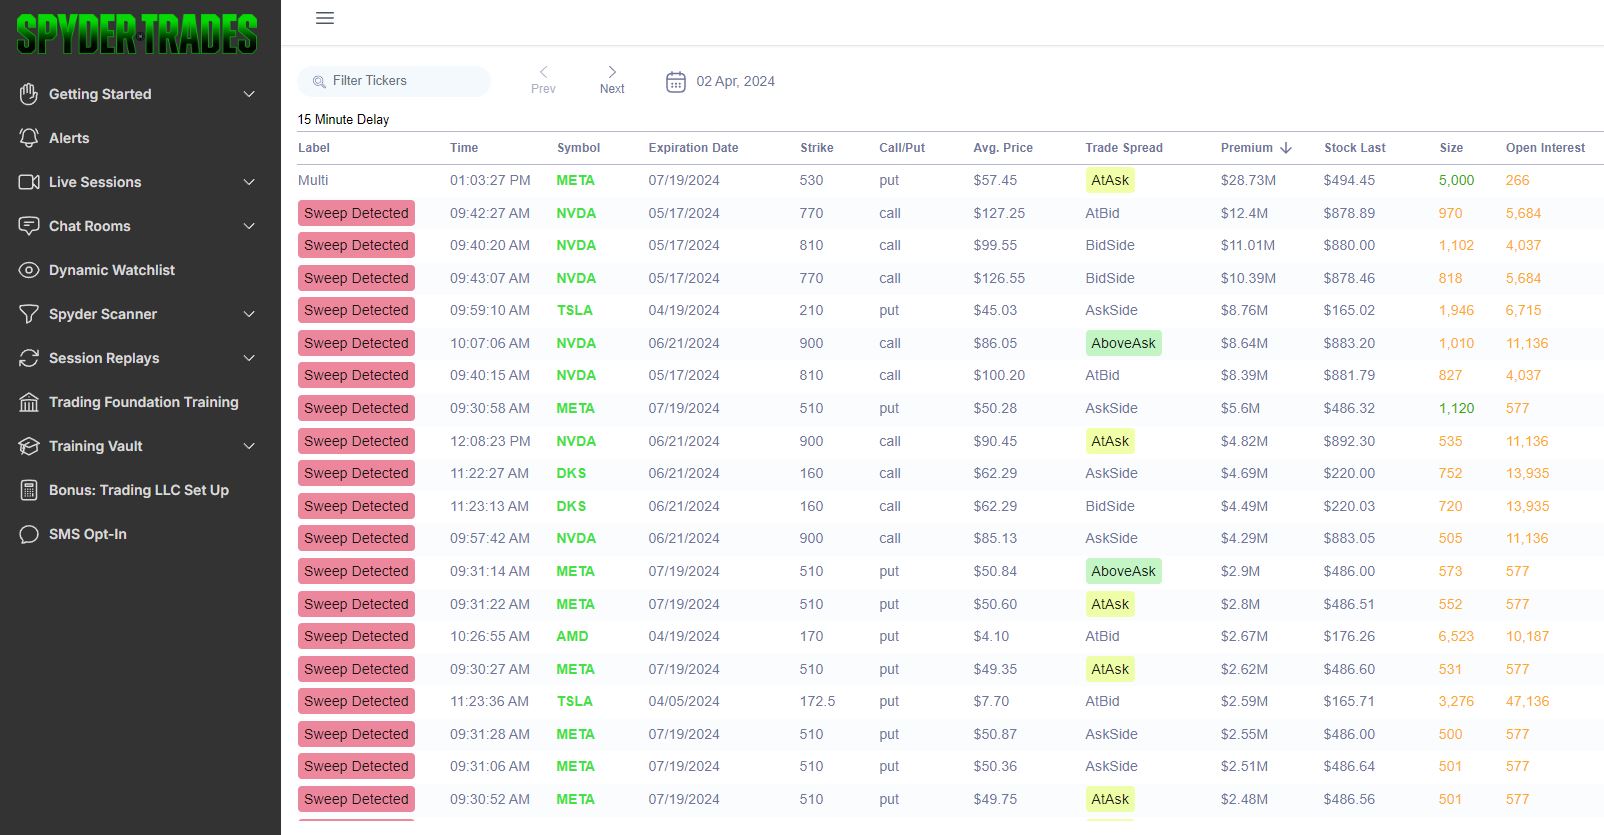
I start my trading day by looking at the Spyder Scanner, sorting by descending premium to see what contracts are getting the biggest bets in dollars.

Then, I’ll go look at those same contracts on their options chains, noting:
- How much higher the volume is relative to the strikes around it…
- How much higher the volume is over the open interest (if daily volume greatly exceeds open interest, that’s especially notable)…
- How much the volume increases throughout the trading day (I want to see volume continue to pour in throughout the day)…
After that, it’s time to consider the strike price.
My favorite contracts to trade are those that are sitting just out-of-the-money (OTM)…
Close enough to the money to be seriously dangerous for market makers, if you catch my drift.
I don’t usually buy in-the-money (ITM) contracts. If I see a huge order on an ITM strike, I’ll check the close OTM strikes and usually choose to trade one of those.
NOTE: Your choice of strike price will often come down to personal preference. The strikes that are just slightly OTM work very well for me from a risk/reward perspective.
But as important as options volume and strike prices are, there’s another factor I look for as further confirmation…
Confirmation on the Chart
If all of the data on the options chain and my Spyder Scanner look promising, it’s time to look at the chart.
I need to like the chart to make the trade, but this is harder to describe.
While certain patterns repeat, every chart is individual, and there isn’t an exact science behind the charts I like and the charts I don’t.
So, to make things simple, I’m gonna show you an example of a daily chart I really like — one that recently led me to a 167% options win (and counting)…*
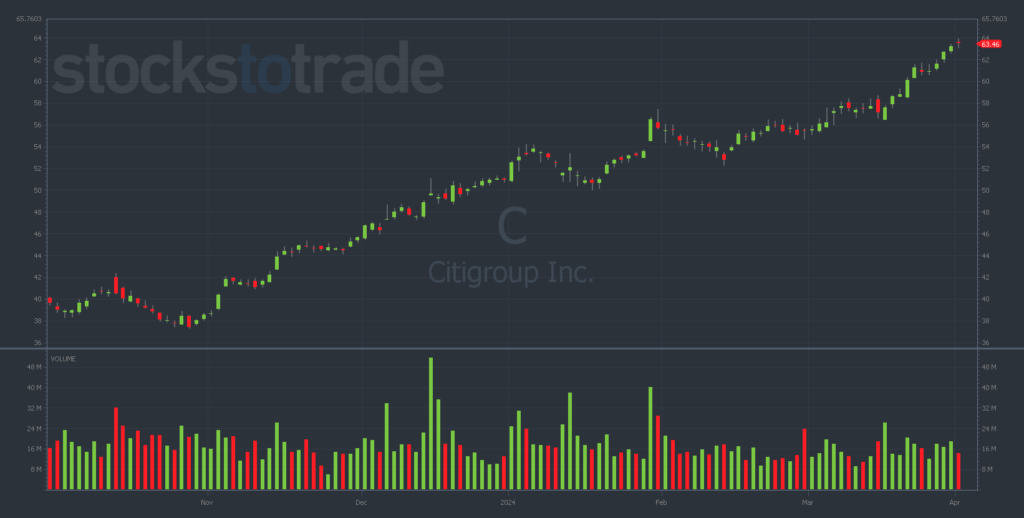
This Citigroup Inc. (NYSE: C) daily chart is a beauty…
You don’t even have to draw a line to see the perfect outline of the uptrend. It’s pretty glorious.
On a chart like this … the trend is your friend.
So, when I saw millions of dollars in ‘smart money’ flying into the 4/5/2024 $62 calls — the chart was confirming the options volume.
As all of these factors lined up, I had all the conviction I needed to pull the trigger.
I bought these contracts on March 25 for $0.73, and then proceeded to scale out of the contracts in chunks:


I’m still holding some of the contracts, but I scaled out of that most recent batch on Monday for a 167% gain.*
I hope you see how this works…
By narrowing the market down to ‘smart money’ bets, that fit my parameters, and sit on top of a beautiful chart — I’m no longer overwhelmed by the vast and overwhelming options market.
I’m zeroing in on contracts with traits that have proven themselves to me time and time again.
Here are two more crucial indicators I look for when viewing trades on my Spyder Scanner:
- Unusual tickers, strikes, or expiration dates — The more unusual the trade, the more conviction that it can carry. If you see a name on the scanner that doesn’t usually get a lot of volume, you should be paying close attention to that chart.
- Huge size, short timeframes — If I see a sweep for six figures expiring in a day or two, that’s far more notable than the same sweep expiring in three months. The immediacy of the bet is important as it can indicate the ‘smart money’ trader’s thoughts on when the move could potentially occur.
Do the same and I bet you’ll results will speak for themselves.
Now, before we go, let’s look at…
💰The Biggest Smart-Money Bets of the Day💰
- $2.02 million bullish bet on BAC 08/16/2024 $37 calls @ $2.69 avg. (seen on 4/2)
- $1.54 million bullish bet on GLD 05/17/2024 $215 calls @ $3.25 avg. (seen on 4/2)
- $862,000 bearish bet on NKLA 04/12/2024 $1 puts @ $0.17 avg. (seen on 4/2)
Happy trading,
Ben Sturgill
P.S. The rest of the market doesn’t know this, but a $2 Trillion Shock is about to shake up Wall Street FOREVER…
TOMORROW, April 4 at 8 p.m. EST … Tim Sykes is going LIVE to break down everything you need to know about this major catalyst, including:
- Why 80 Wall Street banks are ALL moving their money ahead of this looming $2 trillion D.C. shock now…
- The way this shock could change everything for traders in the next 30 days…
- How Sykes was able to generate $2.2 million* in trading profits the last time this D.C. shock hit…
- His unique trade idea for this election-year shock, FREE…
- Why we could see a potential 300% peak move the day AFTER Sykes goes live…
- And much more…
Time is running out — CLICK HERE TO RESERVE YOUR SEAT
*Past performance does not indicate future results

