Happy Tuesday, traders…
Jeff here.
On Monday morning, the U.S. stock market had its biggest sell-off of the year — a major capitulation downward amid an already brutal pullback.
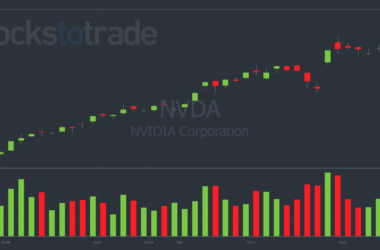
Overvalued tech stocks are leading the avalanche down, with the NASDAQ dropping more than 3% intraday:

But I can’t say that I didn’t see this coming…
I’ve been telling everyone who would listen, from walking my dog to the New York Stock Exchange: Volatility was too low and tech stocks could be in for a walloping.
Given all the crazy stuff happening geopolitically, earning surprises, and the types of moves I was seeing in individual stocks … it just didn’t make sense that the VIX was at $18 last week.
So, we saw the bear move coming, and we saw the VIX explode…
Now, traders across the world are wondering: Is this a garden-variety correction, or is this turning into a full-fledged bear market?
The answer is a bit more complicated — somewhere between the two.
With that in mind, let’s get to my Tuesday Market Outlook…
Where the Market Might Be Headed
So, are we entering a bear market?
I don’t think we’ll go full-blown bear mode, it’s likely to be more of a correction.
I expect a lot of volatility until the November election. Hopefully, we get a decisive resolution and not a messy election. The market hates uncertainty.
NOTE: In my opinion, if Trump wins, we’ll rally harder.
Regarding stocks, I expect to see some serious bottom fishing in tech soon. People still want to own these names. Mainstream USA still sees value in them.
The only significant concern on my radar would be a legitimate Iranian attack on Israel. Not just for show, but an attack causing significant damage — God forbid.
This is where we’re at. There’s a little bit of earnings left, so ride it out. It’s definitely a good time to put some money to work on the long side and make long-term investments. However, don’t get too aggressive with short-term trades right now. I’m not here to say this is the bottom because I don’t think it is.
While we navigate these uncertain times, keep an eye on the broader geopolitical landscape — especially the upcoming election. Politics will heavily influence market movements in the short term.
But remember, volatility brings opportunities, especially for those willing to stay informed and ready to act when the time is right…
The NASDAQ’s Hidden Fibonacci Indicator
Over the past week, I’ve been discussing the downside in the NASDAQ.
We’ve talked about how the market has been overbought and the role of semiconductors in leading us lower.
Meanwhile, the CBOE Volatility Index (VIX) hasn’t been matching the actual volatility we’re seeing in the economy (and across the globe).
If you listened to my advice, bought some volatility, decreased your long positions, or shorted certain stocks — well done.
But that’s in the past. As the market is always forward-looking, we must do the same…
Currently, the NASDAQ 100 futures are leading everything. While many traders and pundits are focused on Japan’s spectacularly terrible issues, they remain a sideshow in comparison to the U.S. stock market.
When the NASDAQ made a top early in July, I used a Fibonacci retracement from the lows in October to identify key levels.
Fibonacci retracements are a popular technical analysis tool used by traders to identify potential support and resistance levels.
They’re based on the Fibonacci sequence, a series of numbers where each number is the sum of the two preceding ones (0, 1, 1, 2, 3, 5, 8, 13, etc.). In trading, specific ratios derived from this sequence (such as 23.6%, 38.2%, 50%, 61.8%, and 100%) are used to predict potential price movements.
Here’s how it works:
Identify the Trend: Determine the high and low points of a significant price movement. For an upward trend, the low point is the start, and the high point is the end. For a downward trend, the high point is the start, and the low point is the end.
Draw the Retracement Levels: Using a charting tool, draw horizontal lines at the key Fibonacci levels (23.6%, 38.2%, 50%, 61.8%, and 100%) between the high and low points of the trend. These lines represent potential levels where the price might retrace (pull back) before continuing in the direction of the trend.
Analyze the Levels:
23.6% Retracement: This is a shallow retracement, indicating a strong trend if the price bounces back from this level.
38.2% and 50% Retracements: These are moderate retracements, often seen as healthy corrections within a trend.
61.8% Retracement: This is a deep retracement, suggesting a possible trend reversal if the price doesn’t bounce back.
On Monday morning, we breached the 50% pullback level in the NASDAQ…

We’ve already seen a 50% regression from the low to the high…
Now, the next critical level to watch is the 61.8% retracement, which is at 17,131. This level is significant because it represents a place where we can expect substantial support.
We could see a serious bounce around those levels. We might even get a bounce before reaching this level, but the 61.8% retracement offers rock-solid support in the NASDAQ.
In this volatile market, it’s crucial to adapt your strategy.
Shrink the game — Reduce your position sizes, shorten your holding times, and remain flexible.
Stay safe out there.
Happy trading,
Jeff Zananiri
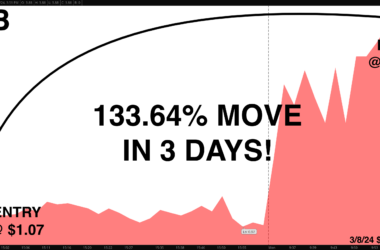
P.S. My brand-new, AI-powered trading system — which can detect algorithmic glitches in real-time with a 90% accuracy rate — has already led to explosive gains like 216% on CHWY calls in 24 hours* and 200% on QCOM puts in 48 hours!*
Click here now to be one of the first 500 people to claim a GAMMA CODE membership.
*Past performance does not indicate future results