Good morning, traders…
Ben here.
The market hasn’t exactly been a cakewalk recently…
With prices sliding lower and volatility spiking, this isn’t a straightforward environment for momentum-based call trading.
But what if I told you there was an easy way to simplify your market outlook during this ultra-volatile period?
It starts with understanding how stocks actually move. Market movements aren’t random — they follow a framework of patterns that reveal shifts in momentum, control, and direction.
This framework is called market structure, and it’s one of the most important tools a trader can use.
Especially now, as bears take control, knowing how to spot the shifts in market structure can help you avoid brutal drawdowns (and find incredible reversal trades).
Today, I’ll show you exactly what market structure is, why it matters, and how you can use it to your advantage…
What is Market Structure?
Market structure is the pattern of highs and lows on a price chart, which creates an overall trend.
It identifies whether the market is trending up, trending down, or moving sideways…
- Uptrends will show higher highs and higher lows.
- Downtrends will show lower highs and lower lows.
- Range-bound consolidation will show the share price moving back and forth between support and resistance.
You should be able to draw clear lines on the daily chart from low to high — or high to low — that form visible trends. If you can’t draw an easily identifiable line on the chart, the trend hasn’t truly formed yet.
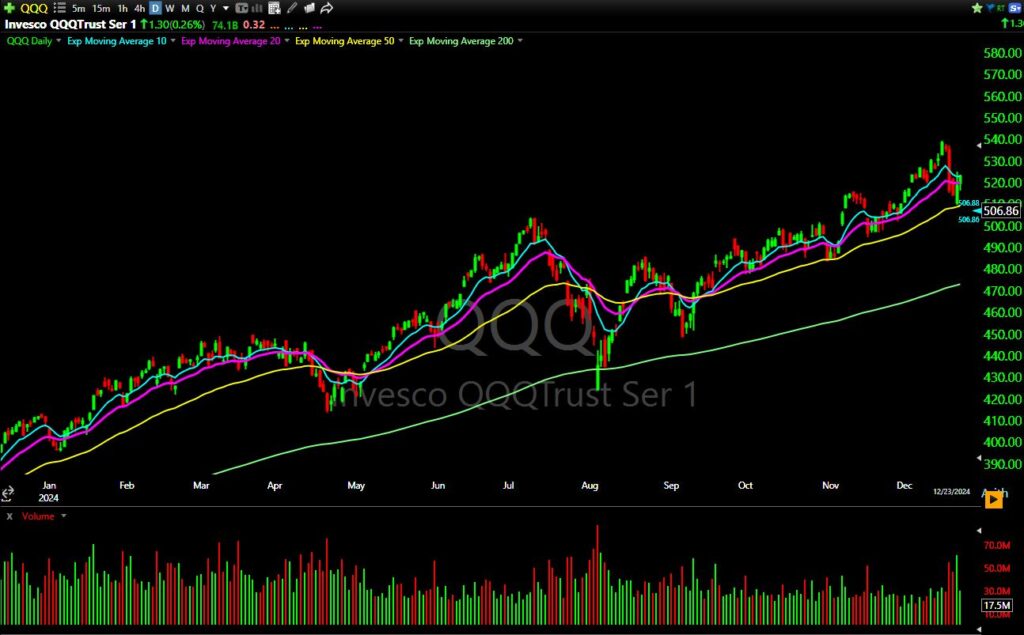
Let’s look at the 2024 daily chart of the Invesco QQQ Trust (NASDAQ: QQQ), which tracks the Nasdaq:

As you can see, the chart tends to surf the 50-day exponential moving average, creating a clear uptrend…
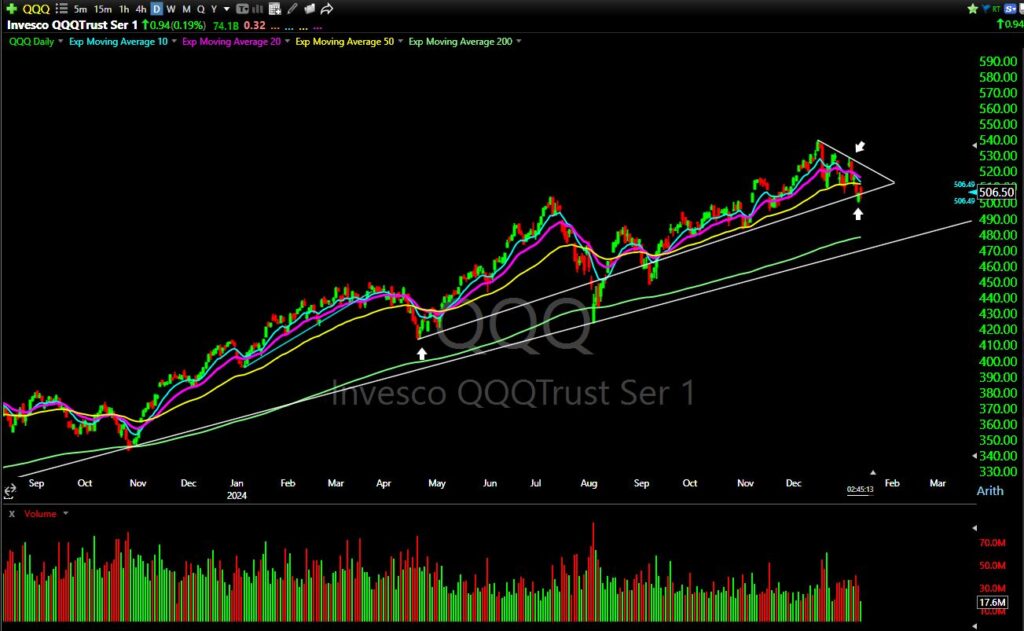
But if we zoom out and update the chart to the present day, you’ll see QQQ is breaking its uptrend below the 50-day, and now forming a visible downtrend:

This is where the real opportunity lies: recognizing major trend reversals.
For example, when QQQ breaks out of its uptrend and into a downtrend, you should know it’s time to be extra cautious on the long side.
Why Market Structure Matters
You’ve probably heard the saying, “A rising tide lifts all boats,” without realizing that it fits the market perfectly…
When the overall market is trending higher, it creates tailwinds that help individual stocks rise right along with it.
But the opposite is also true — when the market pulls back, even the strongest names can struggle to push higher. (Sound familiar?)
Stocks don’t exist in a vacuum, they’re influenced by broader market trends…
Trying to trade against those trends is like running a treadmill at the highest setting: possible, sure, but exhausting and unnecessary.
That’s why trading with the market structure is so important.
When you align your trades with the overall direction, you’re not just relying on the strength of a single stock — you’re leveraging the market’s momentum to make your job easier.
Here are three more reasons to pay attention to market structure:
- Watching how highs and lows evolve can show you who’s controlling momentum — buyers or sellers.
- In the middle of market noise, structure gives you something clear to focus on, simplifying the big picture.
- You can enter and exit trades at more opportune times by identifying trend continuations or reversals.
Considering all this, I’m being very conservative with my trades right now. I’m not much of a put trader, so when the market goes into these bearish cycles, I sit on the sidelines and wait for clear reversals to the upside.
Sometimes, no trade = best trade.
Using Structure in a Bearish Market
Let’s look at how you can use key price levels to apply this knowledge during the recent market downturn:
- Breakdowns Below Support: When price breaks through support with higher volume, it’s often a sign of continued downward movement. This is a sign to avoid calls until the trend curls back up.
- “Pull-ups” to Resistance: After a bearish drop, the share price may retrace back up to a resistance level. These pull-ups — especially on lower volume — are good places to exit calls (if you’re seeing a bearish overall trend).
- Reversal Patterns: Watch for lower lows turning into higher lows. These shifts can indicate buyers stepping back in.
For example, imagine a stock that’s been forming lower highs and lower lows. One day, it fails to make a new low and closes higher instead. That’s a subtle sign that sentiment is shifting.
How to Practice It Yourself
Try this…
- Pull up a chart of any stock or ETF and map the recent highs and lows.
- Mark where trends shifted or continued.
- How would recognizing those patterns have shaped your trades?
Markets will always shift between uptrends, downtrends, and ranges. The traders who thrive are those who can spot the transitions — and act accordingly.
Now, before we go, let’s look at:
💰The Biggest Smart Money Bets of the Day💰
- $17.3 million bullish bet on GLD 01/17/2025 $240 calls @ $6.79 avg. (seen on 1/14)
- $5.5 million bullish bet on NVDA 02/21/2025 $148 calls @ $2.50 avg. (seen on 1/14)
- $2.9 million bullish bet on FCX 01/17/2025 $32 calls @ $7.30 avg. (seen on 1/14)
Happy trading,
Ben Sturgill
P.S. This FRIDAY, January 17 at 12 p.m. EST — the great Danny Phee is hosting a LIVE WORKSHOP to reveal the biggest Smart Money setups for next week…
The recent market volatility is setting up huge opportunities — Click here so you don’t miss the next big move.
*Past performance does not indicate future results


