
Good morning, traders…
Ben here.
Yesterday, we talked about how the trend is your friend — a crucial foundation for directional trading.
But what happens when the trend takes a nap?
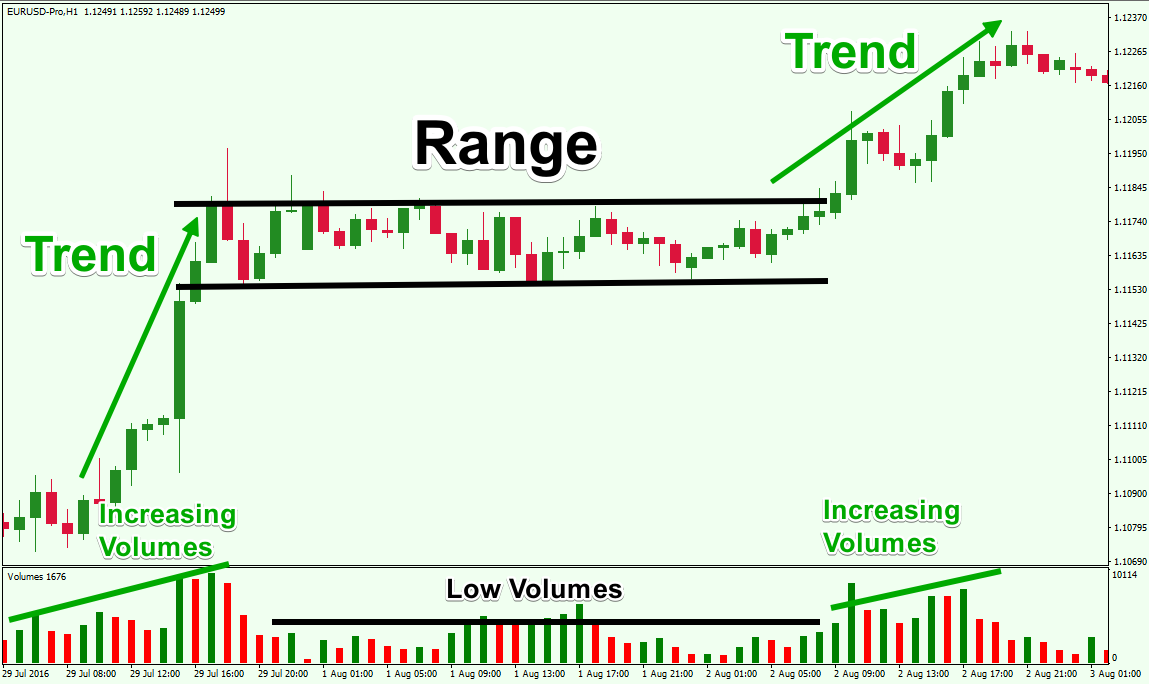
You’ve probably noticed it before: a stock bounces back and forth between two levels, not making any big moves up or down…
This is what we call rangebound consolidation — and if you see it, you shouldn’t trade it.
But look, I get it…
We’ve all been tempted to trade during a sideways stretch because it feels like something should happen…
The chart might look like it’s coiling up, and maybe you’re thinking, “I can get in early before the massive breakout.”
But this is a mistake. Directional options thrive on movement and die with stagnation.
Buying options during consolidation is like bringing a surfboard to a lake — you’re using the right tool in the wrong setting.
Today, we’ll unpack why sideways charts are a no-go for options traders. I’ll show you what to look out for, how to recognize when consolidation is happening, and why patience will pay off handsomely.
Why Consolidation Kills Options Trades
Options love movement. They’re designed to gain value when the underlying stock makes a big push in the right direction.
But when a chart is stuck in consolidation, the price doesn’t go far enough in either direction to let your contracts soar.
And this is where timing makes things even trickier…
Think of your options contract like a melting ice cube. With every passing moment, a little bit of that value drips away, whether the underlying stock moves or not.
This is called time decay, and it’s especially brutal when the stock price is stuck in a tight range.
In a consolidation phase, there’s no big move to offset that slow, steady loss. Time decay doesn’t care that you’re waiting for the stock to wake up — it’s constantly nibbling away at your option’s value.
For traders, this can be a frustrating and costly lesson. Even if you guessed right about the stock eventually breaking out, the time decay might have already eaten through your potential profit by the time it does.
That’s why patience — and knowing when not to trade — is so important.
When you pair the melting ice cube of time decay with the stock’s lack of movement, buying options during consolidation becomes a “no-trade.”
Recognizing Consolidation
So, how do you know when a stock is consolidating?
Look for these warning signs:
Flat or Rangebound Movement: The stock bounces between a clear support and resistance level without breaking out.
Low Volume: Trading volume typically dries up during consolidation because the excitement is elsewhere.
Short Candlesticks: On the chart, you’ll see smaller candles, showing a lack of strong price movement.
If you see a chart that looks like this…
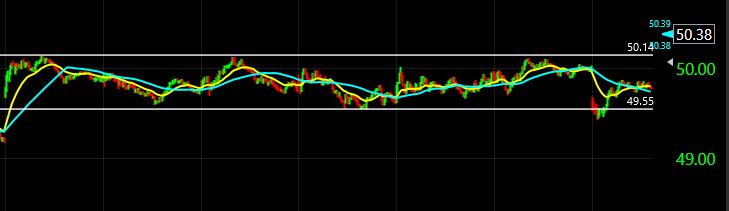
…you shouldn’t buy options until you see a key level break.
What to Do Instead
When you spot a sideways chart, your best move is to wait.
Consolidation can signal that the market is gearing up for a bigger move, but guessing which way it’ll break isn’t trading — it’s gambling.
Instead of anxiously hopping into a trade during consolidation, do the following:
Wait for the Breakouts and Pullbacks: Let the chart tell you where it wants to go. Once the stock breaks through support or resistance on heavy volume, you’ve got a clear signal to act.
Follow the Smart Money: Use my SPYDER Scanner and APEX Scanner to find stocks with strong, clear trends (and huge Smart Money volume).
And speaking of Smart Money…
There are hundreds of insider sweeps to choose from every day on my scanner…
These exact setups have led to gains of 168% on GOOGL, 253% on CCJ, and even a staggering 300% on INTC!*
So, if you want to start nailing trades like those…
Join my buddy Danny Phee TODAY, November 22 at 12 p.m. EST to see the most promising ‘smart money’ setups we’re trading this week.
Seats are limited — Reserve yours before it’s too late!
Trading options during consolidation will get you stuck in boring, frustrating, account-draining trades.
Save your money (and opportunity cost) for setups where the trend is on your side and the chart has a clear direction.
Patience is your greatest virtue. Sit tight, keep scanning the market, and wait for a clear breakout or pullback.
Before we go, let’s look at:
💰The Biggest Smart-Money Bets of the Day💰
- $3.8 million bullish bet on XLE 12/20/2024 $95 calls @ $3.76 avg. (seen on 11/21)
- $2.8 million bullish bet on IBIT 01/17/2025 $55 calls @ $6.50 avg. (seen on 11/21)
- $2.3 million bullish bet on GLD 01/17/2025 $255 calls @ $3.55 avg. (seen on 11/21)
Happy trading,
Ben Sturgill
P.S. The election just triggered the most epic 90-day profit window of the decade…
By identifying 1,500 stocks over the last 20 years that delivered average gains of 3,700% within 90 days of election day — our $3 million AI trading tool has already selected its “Top 5 Plays”…
Join me TODAY, November 22 at 1 p.m. EST to see these ultra-rare, “once-ever-four-years” trading opportunities — Don’t miss this.
*Past performance does not indicate future results