Good morning, traders…
Ben here.
If you’ve ever felt overwhelmed by reading charts and technical analysis — you’re not alone.
Green candles, red candles, volume bars, trendlines … for the uninitiated, making sense of these indicators can be like learning a foreign language.
The key is to keep things simple. With too many lines and levels, it’s easy to get lost.
But when you clean up your charts and stick to the basics, you can spot the crucial signals — that can make (or break) a small account — much faster.
In the options market — where positions can move 30%-50% in minutes — it’s crucial to be able to quickly and accurately analyze your charts.
Take it from me, I’ve been analyzing charts for over 20 years now…

Charts are simply a visual representation of the collective emotions of those trading the stock market.
It’s all about making trading as straightforward as possible, and that’s exactly what strong technical analysis can do.
Today, I’ll show you three simple ways to make charting easier…
Clean Charts
Sometimes I’ll see traders using a chart riddled with dozens of indicator lines crossing into a confusing mishmash, and think … “Why?”
Just like having too many trades on your mind, having too many indicators on your charts can do you a major disservice.
It may seem like the more indicators you use, the better chance you have of carving out an edge for yourself … but this is a fallacy.
Rather, using too many conflicting indicators can lead to more confusion, less directional clarity, and potentially serious eye strain.
You have to learn how to sort the signal (meaningful data) from the noise (useless confusion).
If your charts look anything like this…
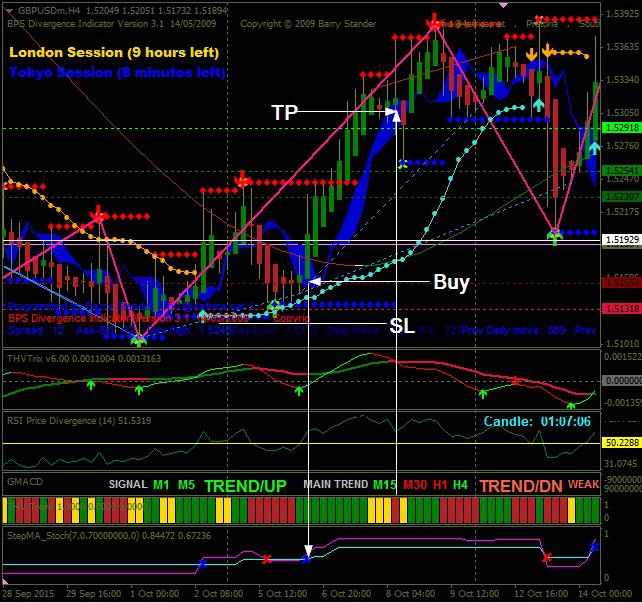
… then it’s time for you to remove some indicators.
Keeping your charts clean will help you keep a clear head while trading.
Plus, not all chart indicators are created equal. I have my favorite technical indicators (more on that later), but they won’t necessarily work for you.
Every trader is unique. You’ve gotta experiment with different indicators to find which ones provide insight into your trading strategy.
Then, once you find the indicators that work for you, don’t overcomplicate things.
You don’t want your charts to look like an Etch-a-Sketch.
Stick to a few reliable technical indicators, like these…
Key Price Levels
In trading, it’s better to be a sniper than it is to be a gunslinger.
This means being picky, selective, and trading the best setups only. And one way to find the best setups is by paying attention to key price levels…
By recognizing key price levels, you can take advantage when they start to crack.
Here’s how to identify them:
- Zoom out on a daily or weekly chart…
- Mark price levels where the chart has been rejected…
- Mark price levels where the chart has bounced…
If the chart bounces at the same price repeatedly, that’s a level of historical support.
If the chart gets rejected at the same price repeatedly, that’s a level of historical resistance.
When a volatile stock finally breaks a level of multi-day, multi-week, or even multi-month resistance — that’s usually an ideal time to buy calls.
The risk/reward on these trades is fantastic. It’s the backbone of my trading strategy that has led to my 84% win rate.*
Moreover, the same is true on the downside…
Once a key level of support gets taken out, the stock often craters.
On both the upside and the downside, when major support or resistance cracks, a big move is often right around the corner.
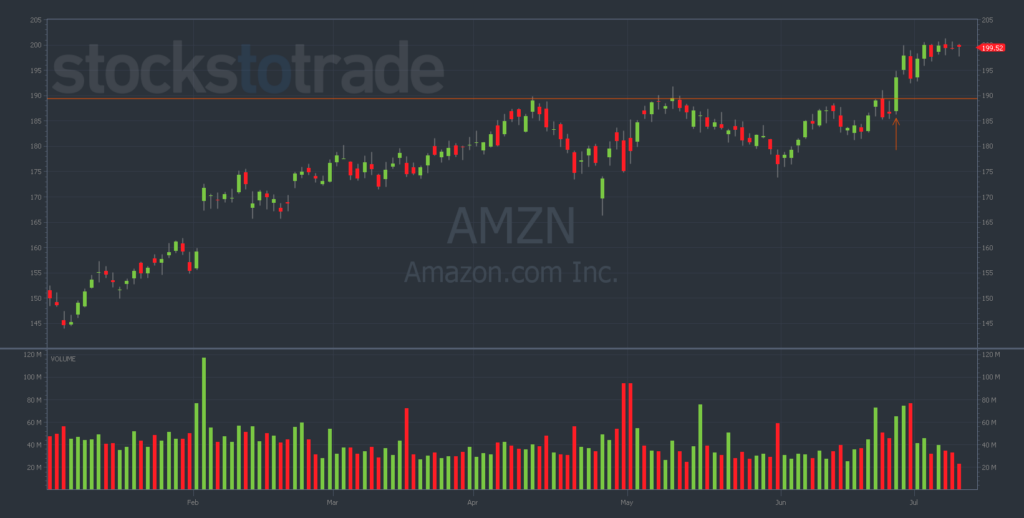
For example, I recently executed one of the best trades of my career on Amazon.com, Inc. (NASDAQ: AMZN), using $190 as my resistance level.
$190 stuck out like a sore thumb on the chart because the stock had tried (and failed) to exceed that level on two separate occasions this year (once in April and once in May)…
Once the stock cracked $190 on huge volume, it was a clear shot to $200…
During my Spyder Webinars, I often call out these key price levels to use as goalposts for a particular ‘smart money’ sweep.
For example, yesterday, I bought calls on Nvidia Corporation (NASDAQ: NVDA) as the stock cracked resistance at $134:
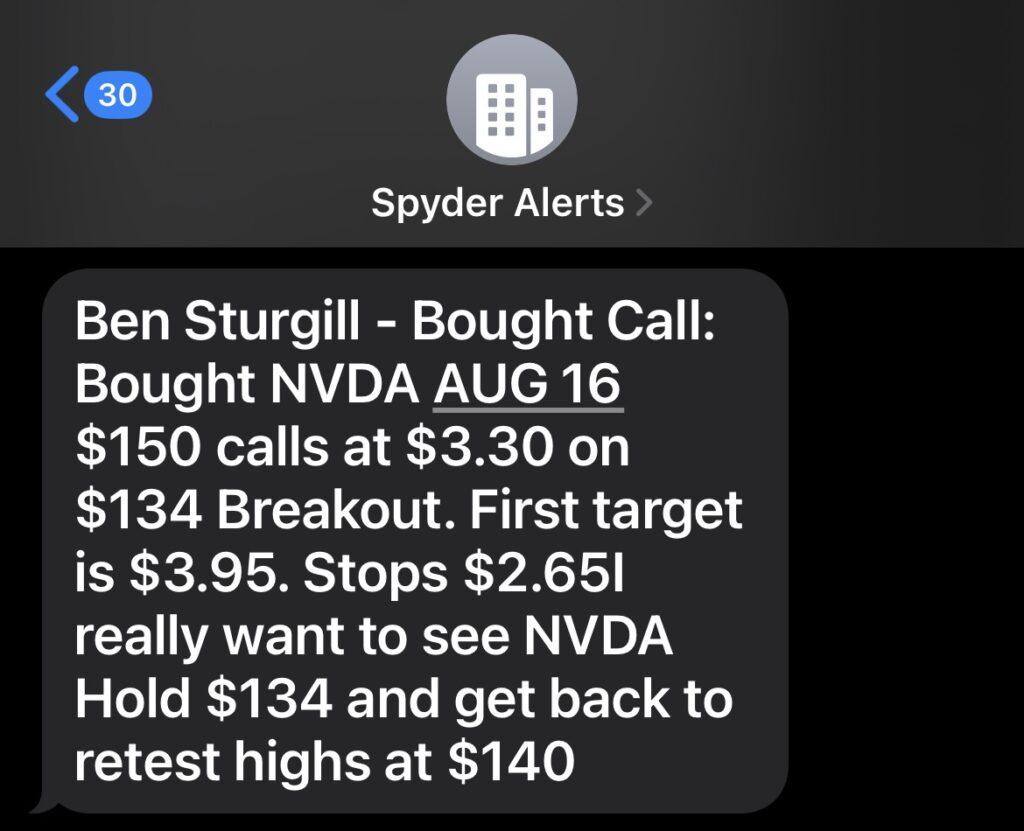
I’ll often see a big bet on my scanner, but don’t want to trade the position until a certain key price level is taken out (like the two I just mentioned on AMZN and NVDA).
By paying attention to — and trading around — key price levels, I avoid a lot of false breakouts and time my trades with precision.
Volume Spikes
Aside from share price, nothing is more important than daily trading volume.
Huge volume spikes often line up with major news catalysts (or a trend reversal in market sentiment).
This makes high trading volume valuable as both a historical and a technical indicator.
To identify important volume, start by drawing arrows or text near big surges in daily trading volume.
Then, when you see the stock have a day where the volume gets close to its previous highs … pay close attention.
That may be an extra-volatile moment to consider making a trade.
That said, just as not all technical indicators are created equal — not all volume spikes are created equal, either.
I’ve always wanted a way to determine where the volume is coming from. And that’s why I built my Spyder Scanner…
My scanner gives access to a whole other level of trading volume — options volume. This shows you the highest-priced bets from the market’s biggest players.
Options volume is a very reliable indicator of future price movement, more valuable than a simple volume spike on a chart.
5 More Technical Indicators I Use Every Day
In addition to the major points I’ve already mentioned, here are five more technical indicators that I always make sure to have placed on my charts:
- 8, 13, 21, and 34-day exponential moving average (EMA) — a type of moving average that places a greater weight and significance on the most recent data points.
- 200-day simple moving average (SMA) — the average price of the stock over a 200-day period, visualized as a “moving” line on the chart.
- 14-day relative strength index (RSI) — a momentum oscillator that measures the speed and change of price movements. RSI reads as a number between 0 and 100. (RSI is usually considered overbought when above 70 and oversold when below 30.)
- Average true range (ATR) — the average of true ranges over the specified period. This measures volatility while considering any gaps in the price movement.
- Volume profile — the volume traded at various price levels over a specified period.
Now, before we go, let’s look at a few of…
💰The Biggest Smart-Money Bets of the Day💰
- $2.87 million bullish bet on GLD 08/16/2024 $222 calls @ $4.00 avg (seen on 7/10)
- $1.8 million bullish bet on AMD 07/12/2024 $185 calls @ $3.54 (seen on 7/10) [RISKY!]
- $1.34 million bullish bet on TLT 09/20/2024 $98 calls @ $0.67 (seen on 7/10)
Happy trading,
Ben Sturgill
P.S. It’s time to unlock the trades you’ve been missing…
Without my Spyder Scanner, you’re out of the loop on MASSIVE setups that have led me to an 84% win rate…*
Ready to get in the know?
TOMORROW, July 12 at 12 p.m. EST, I’m hosting an urgent live briefing to break down the biggest bets I’m seeing this week.
Discover the ‘smart money’ moves that can redefine your trading strategy — Click here to make missing out a thing of the past.
*Past performance does not indicate future results

