
Good morning, traders…
Jeff here.
Today, we’re hopping in a time machine…
Fasten your seatbelts. And listen…
Seven years ago, in early 2018, a shocking move in a particular index had widespread implications on the entire U.S. stock market.
The major benchmark indexes had some of their biggest single-day losses of all time while other exchange-traded products (ETPs) went bankrupt overnight.
So, why am I telling you this now?
Because the current market environment bears an uncanny resemblance to the days and weeks before this infamous event…
By reading the tea leaves of this historic market move, we can identify the best trading opportunities (and steer clear of avoidable losses) in the coming weeks.
With that in mind, let me show you the connection between the current conditions and one of the most insane market days in history…
What Happened (and Why Did It Occur)?
On February 5, 2018, the CBOE Volatility Index (VIX) jumped over 100% in a single day — its largest-ever one-day rise.
This day is now infamous, often called “The 2018 VIX Shock” or “Volmageddon” due to its abrupt nature and impact on volatility-based products.
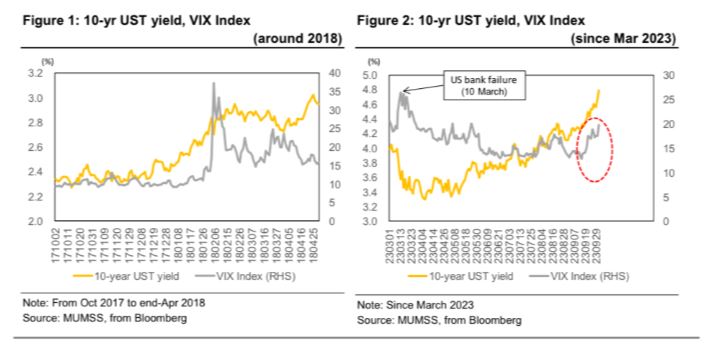
As you can see, the 10-year Treasury yield rose from early December 2017 to the beginning of February 2018 — the trading day before the historic jump in the VIX.
Meanwhile, from October to December 2017, the VIX was really low, at around $10 on average.
Traders talked about this a lot, debating what was causing such suppressed volatility.
However, the VIX began rising in late January 2018…
Then … BOOM!
The VIX went absolutely ballistic on February 5, spiking to $37.3!
So, why did this happen?
While no one knows for sure, there are three popular theories:
- The market was already on edge due to concerns about inflation and potential interest rate hikes by the Federal Reserve.
- A stronger-than-expected wage growth number was reported, increasing fears about inflation and tighter monetary policy.
- A significant number of traders and investors had taken positions that would benefit from continued low volatility. When the VIX started rising, it led to a feedback loop as traders rushed to cover their positions — sort of like a short squeeze for volatility.
The Aftershocks
The aftershocks of “Volmageddon” rippled throughout the entire market…
Certain ETPs that were designed to provide short exposure to volatility (i.e. they would benefit if volatility decreased) suffered massive losses.
For example, the XIV (VelocityShares Daily Inverse VIX Short-Term ETN) lost over 90% of its value and was subsequently terminated.
The sudden spike in volatility and the liquidation of certain volatility products had a cascading effect on the broader stock market.
The SPDR Dow Jones Industrial Average ETF Trust (NYSEARCA: DIA) experienced a drop of over 1,100 points on February 5 — its largest point drop in history at that time.
The event served as a wake-up call for many traders about the risks associated with volatility trading and short-volatility strategies.
But more importantly, it was also an incredible trading opportunity for those who were prepared.
And speaking of being prepared…
Current Conditions Resemble Fall 2018
Let’s look at the macro backdrop of the current market:
The 10-year treasury yield has held a consistent uptrend, rising from 4% in early October to 4.6% as of this Tuesday:

Meanwhile, the VIX had been languishing around $13 through early December.
Then, we got a mini VIX shock on December 18, as the index saw its second-biggest spike of all time.
And now, it’s uptrending in the high $18s, heading back towards $20.
Sound familiar?
That’s right … the current market conditions resemble the 2018 VIX shock.
But let’s not get ahead of ourselves…
As intriguing as this historical parallel might be, there are no guarantees in the stock market.
Plus, because conditions are different now, we can’t directly compare the current market environment to what happened in 2017-2018.
It’s hard to say exactly why the VIX jumped so much in 2018, so it’s tough to understand what’s happening now.
But, if we assume that the 2017-2018 sustained rise in yields had some effect on trader positioning leading to the VIX shock, it goes without saying that this tape requires caution.
History doesn’t necessarily repeat itself, but it rhymes.
I’m not necessarily saying there’s gonna be another VIX shock.
However, I’d be remiss if I didn’t point out the unignorable similarities between today’s market and the conditions in early 2018.
Do with this data what you will. And, as always…
Happy trading,
Jeff Zananiri
P.S. In a volatile trading environment, you need a reliable strategy that performs well under any conditions.
Like my AI-powered GAMMA Code system, which has been delivering me gains like 145%, 235%, 630%, and even 900% every week — all in 24 hours or less…*
This SATURDAY, January 11 at 12:00 p.m. EST, my buddy Danny Phee is hosting a SPECIAL LIVE WORKSHOP to show you how to start weaponizing GAMMA for huge overnight gains.
Seats are filling up quickly — Don’t miss your chance to join.
*Past performance does not indicate future results